Understanding Technical Analysis
Note: This post may contain affiliate links, and we may earn a commission (with No additional cost for you) if you purchase via our link. See our disclosure for more info. The gold and crypto world is constantly changing. This is not financial, investment, legal, or professional advice. So, please verify the information on the gold and cryptocurrency provider’s websites.
Technical analysis is all about crunching numbers and watching price trends, not getting lost in all the rumor mill drama. It believes trends stick around; if prices are climbing, they might keep climbing. Traders keep an eye on demand zones for buying and supply zones for selling. Support and resistance levels? They're like invisible walls in the market. If you're curious about how to truly master this analytical wizardry, there's more to uncover.

Technical analysis. It's the art of predicting future price movements by studying past market behavior. Sounds simple, right? But it's a bit more complex. The core principle? Trends persist. If the market is going up, it tends to keep going up. Downward? Well, brace yourself for more of that. History? It doesn't just repeat; it practically dances a jig.
Everything you need to know is right there in the price. All the juicy bits of public and private information are baked into those numbers. That's why historical price action is your best friend. It's like a crystal ball, but less magical and more data-driven. Prices don't just float around aimlessly; they're driven by the thrilling drama of supply and demand. Buyers and sellers push and pull, and where they congregate creates demand zones poised to launch prices up. Conversely, supply zones can bring the party crashing down. In cryptocurrency markets specifically, using profit calculators can help traders quantify potential returns based on technical analysis predictions before executing trades.
And then there's the whole support and resistance saga. When support breaks, it doesn't just disappear; it flips and becomes resistance. It's like a game of musical chairs but with prices. Recent price zones? Oh, those are the real heavyweights. They matter more than those dusty old levels from ages ago. If you're clinging to old data, you might as well be using a flip phone.
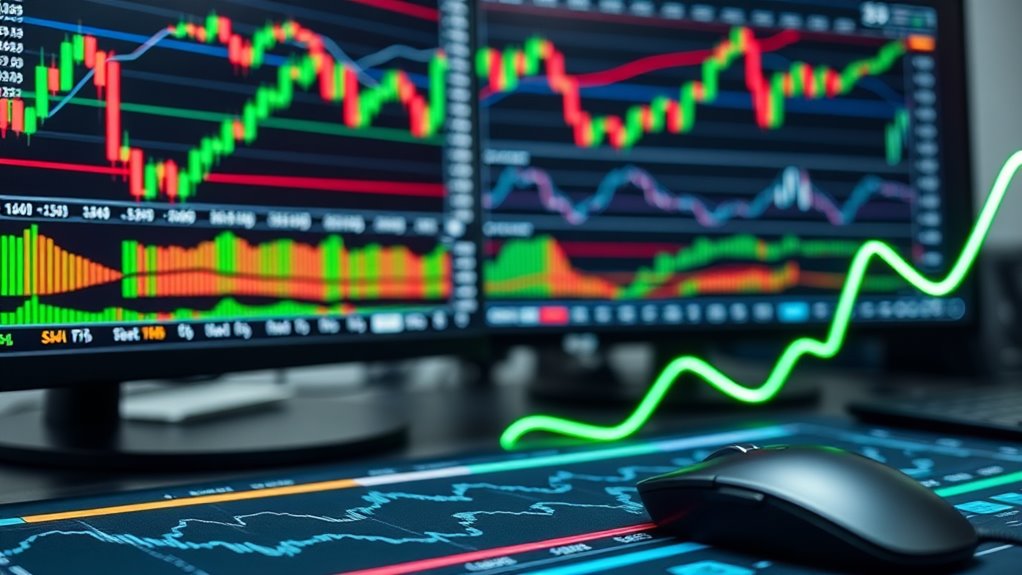
Price charts—those visual tools we all love—are the bread and butter of technical analysis. Line, bar, candlestick; pick your poison. They help track the historical price data and uncover trends. Technical analysis is applicable across multiple time frames for different trading strategies, allowing traders to adapt their approach to various market conditions. Additionally, technical indicators provide insights that enhance decision-making in analyzing price movements.
Frequently Asked Questions
What Are the Main Differences Between Technical and Fundamental Analysis?
Technical and fundamental analysis? It's like comparing apples and oranges.
Fundamental analysis digs into company health and market trends—think long-term investments. It's all about numbers and reports.
Meanwhile, technical analysis stares at charts and patterns, chasing short-term gains like a dog after a squirrel.
One's patient, the other's impulsive. Fundamentalists might miss quick trends, while techies can get lost in chart chaos.
Both have their fans, but good luck picking a side!
How Do I Choose the Right Charting Software for Technical Analysis?
Choosing the right charting software? It's a jungle out there.
Look for platforms that offer various chart types—candlestick, anyone? Indicators are a must; you want tools that aren't just pretty but useful.
Customization? Check. Data coverage? Absolutely.
And don't forget about automation—who doesn't love a little AI magic?
Free trials are your best friend. Just be wary of paywalls. No one likes getting hit with hidden fees.
Happy hunting!
Can I Use Technical Analysis for Long-Term Investing?
Sure, technical analysis can be used for long-term investing!
But don't get too excited. It's mainly a short-term game. Think of it as a sprinkle on your strategy cake.
Key indicators like moving averages? They can help!
But here's the catch: patterns aren't foolproof. They might not repeat. Markets can be unpredictable, and external factors can ruin your day.
What Are Common Mistakes Beginners Make in Technical Analysis?
Beginners in technical analysis often stumble hard. They drown charts in indicators, making decisions way too complicated.
Some cling to a single indicator like it's a life raft, ignoring price action. Others trade against the trend, thinking they're savvy.
Risk management? What's that? They toss money around without stop-loss orders.
And let's not forget emotional trading. Chasing trends after they skyrocket is a surefire way to get burned.
Classic rookie mistakes.
How Do Emotions Influence Technical Trading Decisions?
Emotions are the wild card in trading.
Fear? It makes traders jump ship too early.
Greed? That's a one-way ticket to overtrading.
Overconfidence leads to reckless moves, while hope keeps folks clinging to losing positions like they're lifebuoys.
Regret? Oh, it's the driver for impulsive trades.
And let's not forget biases that cloud judgment.
Traders often ignore red flags, convinced they can outsmart the market.
Spoiler alert: they can't.


